 We thought it might be fun to do a little industry run-down. If you’re considering moving this summer, you might be intrigued to learn more about the moving industry before you settle on a mover to hire. Here’s some data that was released by AMSA.
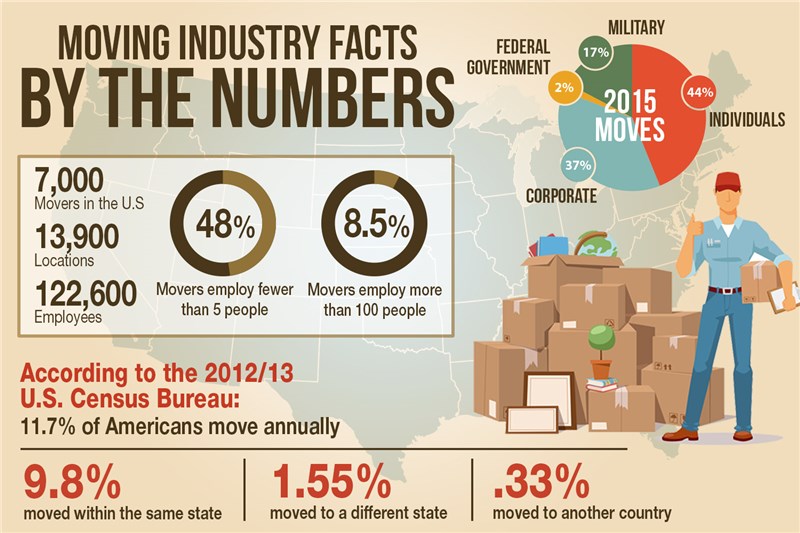
Number of movers in the U.S.: 7,000
Numer of locations in the U.S.: 13,900
Types of movers:
- Van lines
- Van line agents
- Independent full-service movers
- International movers
- Forwarders
- Auto transporters
Number of people employed by the moving industry: 122,600
The moving industry is composed of mostly small businesses, 48% employ fewer than 5 people! Only 8.5% of moving companies employ more than 100 people.
The types of services that moving companies offer:
- Local moving
- Long distance moving
- Transportation of household and office goods
- Warehousing
- Packing
- Process, distribution and logistics consulting
Although movers offer quite a few services, local and long distance moving, warehousing/storage and packing services account for 97.3% of all revenue.
In 2015, 73% of shipments were for household goods, 20% were computers, copiers and electronic office equipment, 6% were exhibits/tradeshows and 1% of moves were office moves.
In 2015, 44% of all moves were for individuals, while 37% were corporate, 17% military and 2% were for the federal government.
Ten most active states – inbound household goods (2015 AMSA):
- Oregon - 65% of shipments inbound
- Idaho - 63%
- Florida - 59%
- North Carolina - 58%
- Texas - 58%
- South Carolina - 57%
- Arizona - 56%
- Virginia - 56%
- Nevada - 55%
- Colorado - 55%
Ten most active states – outbound household goods (2015 AMSA)
1. New Jersey - 64% of shipments outbound
2. New York - 64%
3. Illinois - 63%
4. Connecticut - 60%
5. West Virginia - 59%
6. Pennsylvania - 59%
7. Kansas - 58%
8. Ohio - 57%
9. Michigan - 55%
10. Indiana - 55%
According to the 2012-2013 U.S. Census Bureau – 11.7% of Americans move each year. Out of that group, 9.8% moved within the same state, 1.55% moved to a different state, .33% moved from the U.S. to another country.
Here is a list of reasons why people move:
- Wanted new or better home/apartment – 14.8%
- Other family reason – 14.8%
- Other housing reason -- 14.0%
- To establish own household – 10.4%
- New job or transfer – 9.0%
- Wanted cheaper housing – 8.3%
- Wanted to own home, not rent – 5.8%
- To be closer to work/easier commute – 5.4%
- Change in marital status -- 5.0%
- Wanted better neighborhood/less crime – 3.2%
- Other job-related reason – 2.3%
- To look for work or lost job – 2.1%
- Foreclosure/eviction – 1.8%
- Other reasons – 1.3%
- Retired – 0.7%
- To attend or leave college – 0.6%
- Health reasons – 0.4%
- Natural disaster – 0.05%
- Change of climate – 0.03%
We hope you learned something new to take with you on your next adventure. Maybe you could relate to some of these reasons to move or maybe you saw your state as one that’s active. It’s always intriguing to check out what’s happening in the moving industry across the U.S.
Subscribe to Coleman Worldwide Moving's Blog


Comments